The ForesightXL Five Factor Forecast Framework – A Worked Example
A practical example and why speed matters.
A Practical Example of Structured Forecasting in Excel
The real advantage of the ForesightXL Forecasting Assistant is not simply that it applies a disciplined Five Factor structure. It applies that structure quickly and clearly inside Excel, allowing analysts and business leaders to simulate different futures in minutes.
This worked example demonstrates how structured forecasting in Excel separates deterministic evidence from contextual judgement, and why that separation improves decision-making.
Before walking through the example, it is worth defining the framework clearly.
Note: ForesightXL was developed by the team at Brydens BI. The data shown below has been adjusted slightly.
What Is the ForesightXL Five Factor Forecast Framework?
Forecasts rarely fail because the mathematics is wrong. They fail because the story is not auditable or explainable. Charts often hide what came from the data, what came from interpretation, and what came from managerial judgement.
The ForesightXL Five Factor Forecast Framework prevents that by enforcing separation between:
- Statistical evidence from historical data
- Contextual interpretation of that evidence
- Forward-looking managerial judgement
Every forecast is structured across five explicit components:
- Mathematical Baseline - the baseline trajectory implied by historical evidence
- Recurring Effects – repeatable timing patterns supported by data
- Business Drivers – known forward-looking operational impacts
- Operating Constraints – real-world delivery constraints
- Strategic Adjustments – durable structural shifts in sustainable performance
The mathematical baseline is generated deterministically from the time series. Given the same dataset, it always produces the same result. It becomes the statistical anchor for all subsequent adjustments. The first of those adjustments, is the baseline adjustment, which will be used where the context is clear that it is required. Like all adjustments an explanation and link back to the relevant context is provided.
Nothing is blended implicitly. Each number has a defined origin.
This approach reflects disciplined forecasting principles found in established texts such as Forecasting: Principles and Practice, Practical Time Series Forecasting, and Decision Analysis for Management Judgment.
The objective of the ForesightXL is not a perfect number. It is a forecast you can explain, challenge, adjust, and defend. Results are delivered quickly inside Excel using your existing data and business context captured in natural language, then structured into explicit forecast components.
This framework does not replace sophisticated forecasting systems. It makes iteration faster and structured forecasting more broadly accessible.
A Real Example: Brydens BI Chargeable Hours Forecasting in Excel
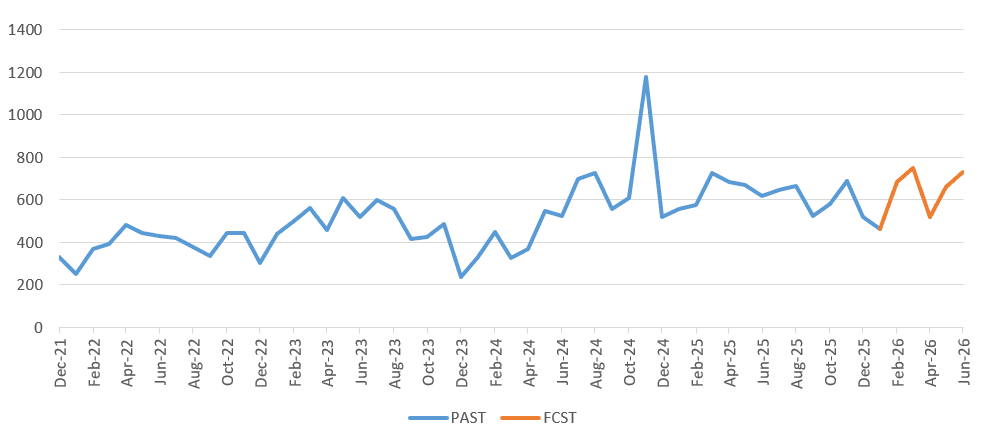
We applied the framework to 50 months of Brydens BI chargeable hours data.
The historical evidence showed:
- A structural uplift from mid-2024 following increased consulting capacity
- Higher volatility accompanying growth
- A clear one-off spike in November 2024
- Softer December and January periods relative to trend
After isolating the November spike and adjusting for the permanent increase in consulting capacity, the data supported a mathematical baseline for early 2026 of approximately 600–650 chargeable hours per month.
That is the statistical anchor.
Applying the Five Factors in Practice
Mathematical Baseline
Baseline sustainable delivery entering 2026 is approximately 620 hours per month.
This reflects the structural increase in consultants and an expanded active client base. The figure is reproducible for a given dataset.
Recurring Effects
December and January show consistent seasonal softness. February is close to baseline, while March tends to be stronger.
These recurring timing effects are derived from the data and layered separately from business judgement.
Business Drivers
Known forward information is then applied explicitly:
- Strong February project completions
- Continued March pipeline delivery
- Expected commencement of a large international client in June
These impacts are quantified and time-bound.
Operating Constraints
As utilisation increases, delivery constraints begin to appear.
In April, a consultant absence reduces achievable hours materially. The reduction is applied explicitly rather than absorbed into the baseline.
Strategic Adjustments
The structural uplift from increased consulting capacity is already reflected in the Core Outlook.
Strategic adjustments remain modest and short-term. Importantly, no structural uplift is applied in June. While client demand increases, there is no resourcing expansion to justify lifting the sustainable baseline.
The deterministic anchor remains intact.
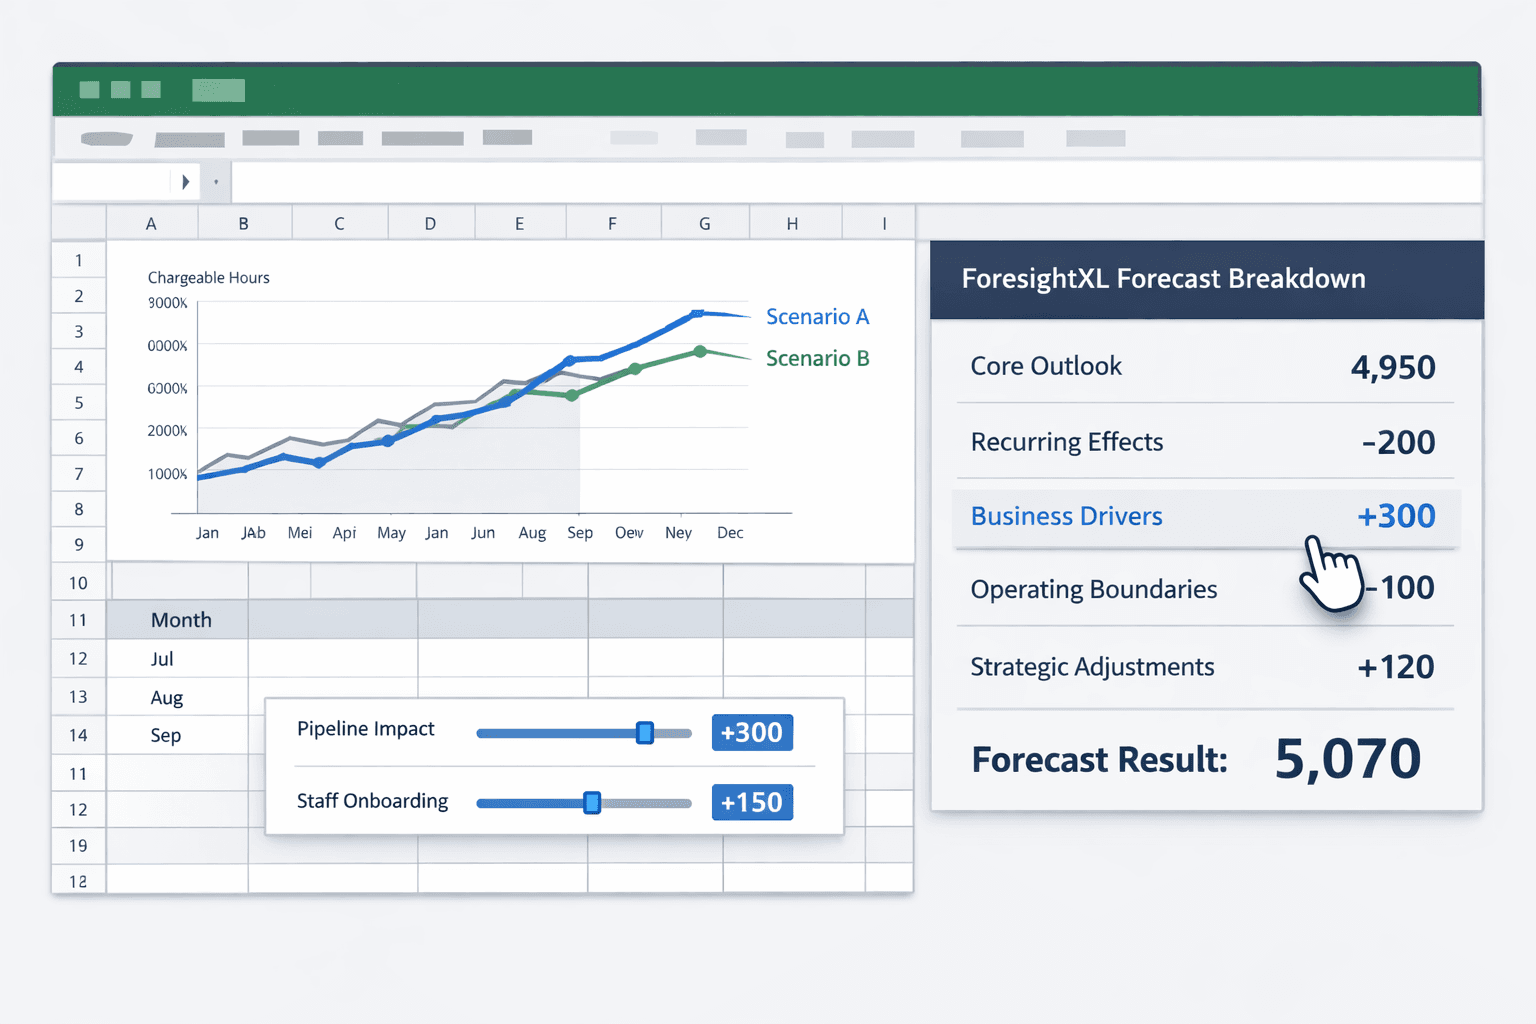
Structured Forecast Output in Excel
ForesightXL generates a decomposed view of the forecast directly inside Excel.
Each forecast period shows:
- Mathematical Baseline
- Recurring Effects
- Business Drivers
- Operating Constraints
- Strategic Adjustments
Nothing is hidden inside a formula. Every adjustment is visible and attributable.
The deterministic mathematical baseline remains constant unless the historical data changes. The output makes that anchor explicit.
Visualising the Structured Forecast
The graphical output reflects the same structure. The total forecast is displayed alongside its component drivers, reinforcing that the forecast is built transparently rather than implied by a single formula.
Scenario Simulation in Excel
Because the framework separates evidence from judgement, changing assumptions does not corrupt the baseline.
Scenario A: Client commences in June. Forecast approximately 730 hours.
Scenario B: Client start delayed to July. June reverts to approximately 610 hours, with July increasing accordingly.
What does not change:
- The mathematical baseline remains anchored to historical evidence
- Recurring Effects remain intact
- Only Business Drivers shift
Inside Excel, this takes seconds. Update the business context in plain English. Regenerate the forecast. Review the structured impact across all five components.
The structure remains constant. The assumptions change.
This is where structured forecasting and AI in Excel become practical rather than theoretical.
What the Example Demonstrates
Applying the framework internally clarified several important points:
- The November spike was a genuine one-off, not a new structural baseline
- Increased consulting capacity produced a measurable and durable uplift
- December and January softness was cyclical, not structural
- Capacity pressure began appearing earlier than expected
The framework did not simply generate a number. It clarified what was structural, what was noise, and where operational pressure was emerging.
Most importantly, assumptions could be stress tested quickly without rebuilding spreadsheets or blending judgement into trends.
The Practical Advantage
The Five Factor Framework provides discipline. The ForesightXL Forecasting Assistant provides speed and clarity inside Excel.
In practice, this means you can:
- Separate what the data genuinely supports from what you are assuming
- Make commercial judgement visible instead of embedding it in formulas
- Stress test pipeline, utilisation, hiring, pricing, or capacity assumptions
- Isolate one-off events without distorting long-term trends
- Compare scenarios without rebuilding models
The structure remains consistent. Only the assumptions change.
Forecasting is not about certainty. It is about clarity.
When business context can be adjusted and a structured forecast regenerated in minutes inside Excel, forecasting shifts to active decision support.
That is the practical advantage.
Methodological Foundations
The ForesightXL Five Factor Forecast Framework was developed through practical consulting experience and informed by established forecasting literature. It reflects principles consistently reinforced across leading works in statistical forecasting and decision analysis.
Key influences include:
- Forecasting: Principles and Practice (3rd Edition) – Hyndman & Athanasopoulos
Reinforces starting with statistically grounded baselines, separating signal from noise, and favouring transparency over unnecessary complexity. - Decision Analysis for Management Judgment (5th Edition) – Goodwin & Wright
Emphasises structured managerial judgement, bias awareness, and making uncertainty explicit rather than embedding it implicitly inside models. - Practical Time Series Forecasting – A Hands-On Guide – Galit Shmueli
Highlights benchmarking against simple models, validating on unseen data, and ensuring forecasts perform in live operating environments. - Superforecasting: The Art and Science of Prediction – Tetlock & Gardner
Reinforces probabilistic thinking, calibration, and the discipline of updating forecasts as evidence changes.
The Five Factor structure synthesises these themes into a practical operational model: deterministic mathematical baselines, explicit separation of recurring effects, structured treatment of business drivers, recognition of operating constraints, and transparent managerial adjustments.
The framework does not attempt to reinvent forecasting theory. It operationalises established principles in a structured and explainable way inside Excel. If you want to see how the mathematical starting point is chosen, see Choosing the Right Baseline Method in ForesightXL. For improving assumption quality, see What Good Forecasting Context Looks Like.