Choosing the Right Baseline Method in ForesightXL
How to choose the mathematical starting point for your forecast before adding business context, judgement, and scenarios
A useful forecast needs more than a number. It needs a clear starting point, a clear reason for any adjustments, and a way to test what might happen if the assumptions change.
That is why the baseline method matters. Before adding business context, management judgement, or scenario assumptions, finance teams need to understand what the historical data is suggesting on its own. Is the data showing a long-term trend? Is recent performance more important than older history? Is there seasonality? Has the current run rate changed?
ForesightXL is designed to help with that separation. The selected baseline method creates the mathematical starting point. Business context can then be used to create explained adjustments, and scenarios can be built by changing the assumptions rather than rebuilding the forecast from scratch. If you want a practical guide to writing those assumptions clearly, see What Good Forecasting Context Looks Like.
What is a baseline forecast?
A baseline forecast is the forecast produced from historical time series data before any additional business context is applied. It is the forecast that answers a simple question: what would the future look like if we projected the available history using this particular method?
That does not mean the baseline is the final answer. In many finance settings, it should not be. The baseline is a disciplined reference point. It helps separate what the data says from what the business knows, expects, or wants to test.
This distinction is important because forecasts often become difficult to explain when historical trends, manual overrides, commercial assumptions, and scenario logic are all blended together. A clear baseline makes it easier to see where the forecast started, why it changed, and which assumptions need to be reviewed.
Why the baseline method matters
Different baseline methods read history in different ways. One method may emphasise the long-term direction of travel. Another may focus more on recent performance. Another may try to adapt to trend and seasonality. Another may explicitly separate seasonal patterns before forecasting the underlying trend.
None of those approaches is automatically best in every situation. The right method depends on the shape of the data, the amount of history available, and the forecasting question being asked.
The goal is not to choose the most complex method. The goal is to choose the most appropriate starting point. In practical finance work, a baseline should be explainable enough to support review, challenge, and discussion with stakeholders. The same principle underpins the ForesightXL Five Factor Forecast Framework, and it is also why forecast quality is often better judged through uncertainty and decision usefulness rather than false precision (see Forecast Uncertainty vs Accuracy).
The five ForesightXL baseline methods
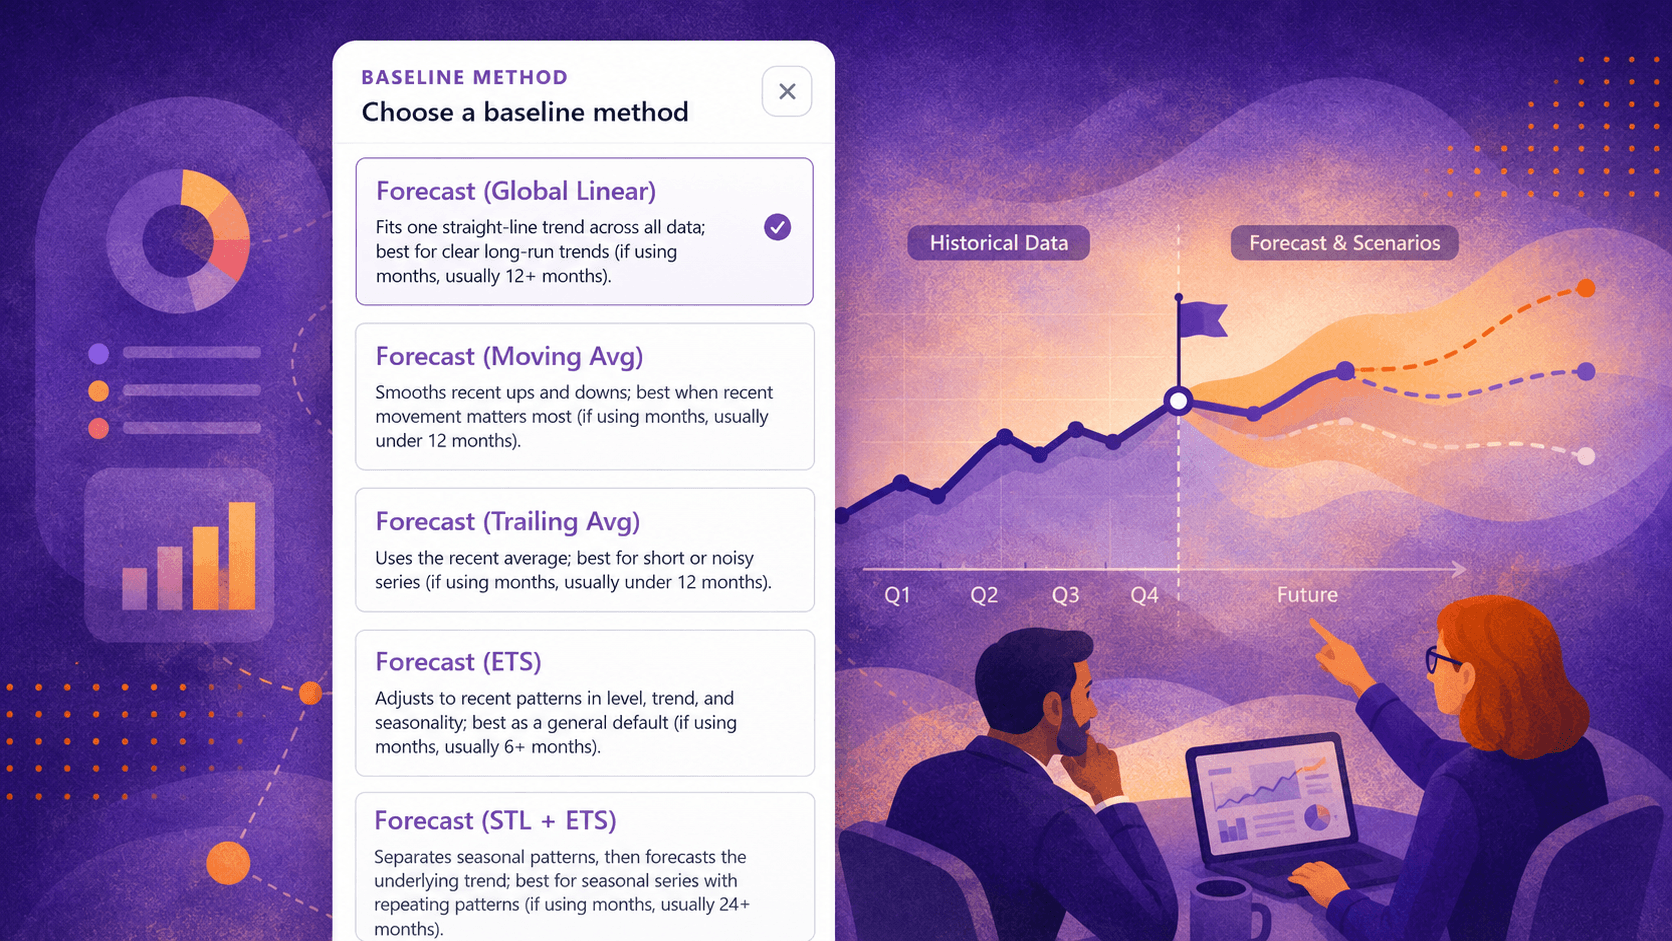
ForesightXL provides five baseline method options. Each one gives a different way to project the historical data before business context and scenarios are applied.
Forecast (Global Linear)
Forecast (Global Linear) fits one straight-line trend across all the historical data. It is best suited to series where there is a clear long-run direction and where that overall direction is more important than short-term movement.
This method is often most useful when the data has around 12 or more months of history and the pattern is reasonably steady. For example, a product line with consistent month-by-month growth may be a good candidate for a Global Linear baseline.
The main risk is that a straight-line trend can oversimplify the data. It may not handle seasonality well, and it may miss a recent shift in momentum. If the business has changed materially, a long-run linear view may continue projecting a pattern that is no longer representative.
From a scenario perspective, Global Linear can be a useful base when the first question is: what happens if the long-term direction of travel continues? Scenarios can then test whether a known business event accelerates, delays, or reverses that trend.
Forecast (Moving Avg)
Forecast (Moving Avg) smooths recent ups and downs. It is useful when the latest movement in the data matters more than the full historical pattern, particularly when the series is shorter or somewhat noisy.
This method can be helpful when using monthly data with less than 12 months of history. It can also be useful when recent trading conditions are more relevant than older periods, such as after a sales team restructure, a change in marketing activity, or a shift in customer demand.
The main watch-out is that smoothing can hide important changes. It may also understate seasonality or treat short-term volatility as more meaningful than it really is. A recent average can be practical, but it still needs review.
Moving Avg works well with scenarios where the key question is whether recent conditions continue. For example, the base case may assume the recent trading environment holds, while upside and downside scenarios test whether momentum improves or deteriorates.
Forecast (Trailing Avg)
Forecast (Trailing Avg) uses the recent average as the basis for the forecast. It is best for short or noisy series where the current run rate is a more useful starting point than a trend calculated across the full history.
This method is particularly relevant when there is limited history, when the data is volatile, or when the latest few periods are the most representative view of the business. It can be useful for cost lines, operational metrics, or early-stage revenue streams where the question is less about trend and more about current run rate.
The main risk is that a trailing average can be distorted by recent one-off spikes or dips. If the latest periods include unusual activity, the baseline may carry that unusual activity forward.
From a scenario perspective, Trailing Avg is useful when the baseline should represent current performance. Scenarios can then adjust for known upcoming changes, such as price increases, customer churn, capacity constraints, supplier cost changes, or a planned campaign.
Forecast (ETS)
Forecast (ETS) adjusts to recent patterns in level, trend, and seasonality. It is a general-purpose forecasting option and can be useful when the series has enough history for the method to identify a meaningful pattern.
ETS can be a strong default when the data is not simply flat, purely linear, or purely seasonal. It is designed to respond to the shape of the series, which makes it useful when recent level, trend, or recurring movement may matter. For monthly data, it is generally more useful when there are at least six months of history.
The main limitation is that ETS still only knows what is in the historical data. If a major customer is about to leave, a new product is launching, or a price change is planned, that information needs to be added as business context. The method may adapt to history, but it cannot know future business decisions unless they are supplied.
ETS works well when the baseline should reflect the observed shape of the data, and scenarios should then test assumptions that are not fully visible in the history.
Forecast (STL + ETS)
Forecast (STL + ETS) separates seasonal patterns, then forecasts the underlying trend. It is best suited to series with clear repeating patterns and enough history to identify those patterns reliably.
This method is often relevant when using monthly data with around 24 or more months of history. That longer history helps distinguish recurring seasonal behaviour from one-off noise. Examples might include retail revenue with a regular December peak, demand that rises each summer, or operating costs that follow a recurring annual cycle.
The main watch-out is that STL + ETS needs enough data and a reasonably consistent seasonal pattern. If seasonality is weak, irregular, or has changed structurally, the method may be less appropriate.
From a scenario perspective, STL + ETS is useful when the baseline needs to preserve recurring seasonal behaviour. Scenarios can then focus on business drivers that alter the underlying trend, change the magnitude of seasonal peaks, or disrupt the usual pattern.
How to choose the right baseline method
The easiest way to choose a baseline method is to start with the shape of the data. The method should reflect the pattern that is most relevant to the forecast, not simply the method that is most familiar.
If the data has a clear long-term trend
Consider Forecast (Global Linear). This is most appropriate when the data has a steady upward or downward direction and there is no strong reason to believe that recent periods should carry much more weight than older periods.
This can work well for mature revenue streams, stable growth metrics, or other series where the long-term trend remains relevant. It is less suitable if the series has strong seasonality or if the business has recently changed direction.
If recent performance matters more than older history
Consider Forecast (Moving Avg) or Forecast (Trailing Avg). These methods are useful when the recent run rate or recent movement is more relevant than the full historical data set.
This situation often occurs when the business has changed, when there is limited history, or when older data no longer reflects the current operating environment. The key judgement is whether the recent periods are genuinely representative or whether they include abnormal events that should not be carried forward.
If the data has trend, level changes, or possible seasonality
Consider Forecast (ETS). ETS is useful when the data has a pattern, but that pattern is not simply a straight line or a basic run rate. It can adapt to changes in level, trend, and seasonal movement.
This makes it a practical general-purpose option. However, it should still be reviewed carefully, especially when there are known business events that history alone cannot capture.
If the data has clear repeating seasonality
Consider Forecast (STL + ETS). This is most useful when the historical data shows a recurring seasonal pattern and there is enough history for that pattern to be separated from the underlying trend.
The important question is whether the seasonality is real, recurring, and likely to remain relevant. If it is, STL + ETS can create a baseline that better reflects the rhythm of the business.
Baseline first, scenarios second
A baseline method should not be expected to do everything. Its role is to project the historical data in a structured way. Scenarios have a different role: they test what could happen if specific business assumptions change.
This separation is useful. The baseline answers: what does the historical data suggest? Scenarios answer: what could happen if the business context changes? For a deeper look at scenario design, see Five Advantages of Scenario-Based Forecasting. If you are working in an FP&A role, the use case on AI Forecasting for FP&Ashows how baseline selection and scenarios connect in practice.
Common scenario assumptions include:
- A campaign performs better or worse than expected.
- A major customer renews, delays, or churns.
- A price increase affects volume from a specific month.
- Demand softens in a key market.
- Supply constraints limit fulfilment.
- A new product launch starts earlier or later than planned.
- Operating costs increase because of a supplier contract change.
If all of that judgement is forced directly into the baseline, the forecast becomes harder to explain. Keeping the baseline separate makes it easier to see what history implied before the scenario assumptions were applied.
A brief worked example
Suppose a business has 30 months of monthly revenue data. Revenue usually increases towards the end of the year, drops back in January, and then builds gradually through the next cycle. Management is also considering a price increase from the start of the next quarter.
In this situation, Forecast (STL + ETS) may be a suitable baseline method because there is enough history to identify a repeating seasonal pattern. The baseline can reflect the normal annual rhythm of the business before the pricing assumption is introduced.
The team could then test several scenarios:
- Base case: normal seasonality continues, and the price change has a modest effect on demand.
- Upside case: customers accept the price increase, and volume remains stable.
- Downside case: the price increase reduces volume from the implementation month.
- Delay case: the price change is postponed by one quarter.
- Stress case: seasonality is weaker than usual, and demand softens at the same time.
The important point is that the baseline and the scenarios are doing different jobs. The baseline captures the historical seasonal pattern. The scenarios capture the business assumptions around pricing, timing, and demand response.
Common mistakes when choosing a baseline method
Selecting a baseline method is a judgement call, but some mistakes are common.
- Using Global Linear when the data is clearly seasonal. A straight-line trend may miss the recurring peaks and troughs that matter most to the forecast.
- Using Trailing Avg when the latest periods include one-off activity. A recent average can be distorted if the current run rate is not normal.
- Using STL + ETS without enough history. Seasonal methods need enough data to identify a repeating pattern.
- Treating ETS as a final answer. ETS can adapt to historical patterns, but known future events still need to be supplied as business context.
- Building scenarios directly into the baseline. This makes it harder to tell what came from history and what came from judgement.
- Choosing the most complex method instead of the most explainable one. Forecasting is also a communication process. The method needs to support review and discussion.
A simple method selection guide
The table below gives a practical starting point for choosing between the ForesightXL baseline methods.
| Situation | Consider this ForesightXL method | Why |
|---|---|---|
| Clear long-term trend | Forecast (Global Linear) | Projects the overall direction of travel across the full history. |
| Short series with recent movement | Forecast (Moving Avg) | Smooths recent ups and downs when recent performance matters most. |
| Short or noisy series needing a run-rate view | Forecast (Trailing Avg) | Uses the recent average as the starting point. |
| General forecasting need with level, trend, or seasonality | Forecast (ETS) | Adapts to recent patterns in the historical data. |
| Clear repeating seasonal pattern with enough history | Forecast (STL + ETS) | Separates seasonality before forecasting the underlying trend. |
Keeping the forecast explainable
The value of choosing a baseline method is not just statistical. It is also practical. A clear baseline helps finance teams explain the forecast more effectively.
A strong workflow is:
- Choose the baseline method that best reflects the historical pattern.
- Generate the mathematical baseline.
- Add plain-English business context.
- Review the forecast adjustments created from that context.
- Compare the final forecast with the original baseline.
- Create scenarios by changing the assumptions.
- Use the output to support discussion, challenge, and refinement.
This workflow keeps the forecast more transparent. Stakeholders can see the historical starting point, the assumptions that changed it, and the resulting impact by period. That makes the forecast easier to review and easier to challenge constructively.
For step-by-step guidance on running forecasts inside Excel, the ForesightXL User Guide is the best place to start.
In a finance process, that transparency matters. The purpose of forecasting is not only to calculate a number. It is to create a view of the future that the business can understand, test, and improve.
Conclusion
Choosing a baseline method is not about finding a perfect forecast. It is about choosing the most appropriate mathematical starting point for the data in front of you.
Forecast (Global Linear) can be useful for clear long-term trends. Forecast (Moving Avg) and Forecast (Trailing Avg) can be useful when recent performance or current run rate matters most. Forecast (ETS) can provide a flexible general-purpose baseline. Forecast (STL + ETS) can be useful when the data has clear repeating seasonality and enough history to support that analysis.
Once the baseline is clear, business context and scenarios become more useful. Teams can see what history suggested first, then test how known developments, risks, opportunities, and management assumptions could change the forecast.
That is the practical value of method choice in ForesightXL: it helps finance teams start from a clear baseline, add judgement transparently, and build forecast scenarios that are easier to explain, review, and discuss.